
Heatmaps and session recordings show what people do on the page: where they click, how far they scroll, where they hesitate. Used well, they generate concrete improvement hypotheses. Used badly, they lead to hasty conclusions from few cases.
The essentials in a definition
Heatmaps and session recordings turn observation of behaviour into test hypotheses: where people click, how far they scroll, where they hesitate and leave. For advertisers, they help understand why paid traffic does not convert. Their use requires complying with the GDPR and the ePrivacy Directive, masking sensitive data, and the analysis benefits from the usability best practices of the Nielsen Norman Group.
What they show
Click and movement maps reveal what attracts attention and what is ignored. Scroll maps show how far people read. Recordings show real journeys: clicks on elements that are not buttons, hesitations, form errors, exits.
They are qualitative observation: they say what happens, not always why.
How to analyse
Start with the question: where do people drop off? Choose the pages with the most paid traffic and the worst conversion. View several recordings by segment (mobile, desktop, source). Look for repeated patterns rather than isolated cases. Cross-check with quantitative funnel data.
Note what you see, without over-interpreting.
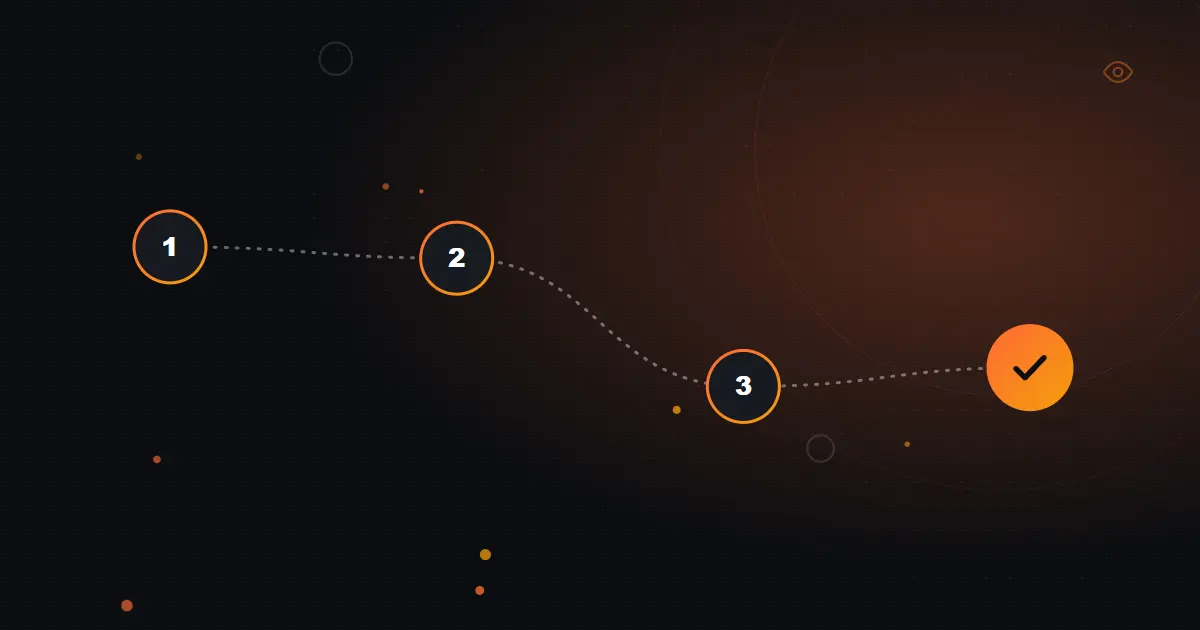
From heatmap to hypothesis
- Choose pages with lots of traffic and little conversion
- See patterns across several segments
- Turn each pattern into a hypothesis
- Test and measure the effect
Turning into hypotheses
“Many people tap the image, thinking it is a button” leads to making the image clickable or changing the design. “Few reach the form” leads to moving it up. “Many abandon at the phone field” leads to making it optional. Each observation generates a hypothesis to test.
Prioritise by expected impact and effort.

Observing changes the question from what I think to what happens.
Cautions
Respect privacy: do not record sensitive data, mask form fields, inform in the cookie notice and respect consent. Beware of small samples. Complement with tests and direct customer feedback.
Review regularly: what you learned six months ago may no longer hold.
Decision table
| Tool | What it shows | Typical hypothesis |
|---|---|---|
| Click map | Where people click | Elements that look clickable but are not |
| Scroll map | How far people read | Important information is too far down |
| Session recordings | Individual journey | Confusion in forms and navigation |
| Funnels and drop-off | Where people are lost | Step with excessive friction |
Common mistakes to avoid
- Collecting sensitive data. Mask form fields and personal data.
- Watching few sessions and generalising. Look for patterns across many.
- Observing without testing. Turn observations into hypotheses and test.
How to measure the result
Record the hypotheses generated, tests done and results, and track conversion and bounce before and after.
Limits and exceptions
The tools give clues, not proof: an observed behaviour may have several causes. Sampling and devices influence what is seen, and data may have gaps. There are privacy risks if configuration is careless. Avoid big decisions based on few recordings, and combine with quantitative metrics and user feedback.
Illustrative example
Illustrative example: a company analyses recordings of paid visitors and sees many try to click an image that is not a link. It turns it into a button to the next step and repositions pricing information above the fold. It tests the change with an A/B test. Conversion rises, and later recordings show less hesitation.
In practice: checkpoints
Turn each observation into a hypothesis with a measurable outcome: what you saw, what you think causes it, what you will change and how you will check. Watch a handful of sessions per device for the pages that matter, look for repeated patterns rather than single odd cases, and prioritise by traffic and value. Respect privacy by masking sensitive fields, and test the changes with a controlled comparison before rolling them out.
Frequently asked questions
How many recordings should I watch?
Enough to identify repeated patterns, by segment.
Do heatmaps replace tests?
No. They generate hypotheses that should be tested.
Are there privacy risks?
Yes. Mask sensitive fields and respect consent.
Do these tools need consent?
Generally yes, when they use device storage or process personal data; configure consent and mask sensitive data.
How many recordings should I watch?
Enough to find repeated patterns, typically a few dozen per segment.
Heatmaps and recordings generate hypotheses about behaviour; use them with consent and data masking, and confirm hypotheses with tests.
Sources and recommended reading
- General Data Protection Regulation (GDPR)
- Nielsen Norman Group: usability articles
- ePrivacy Directive (2002/58/EC)
Last editorial review: October 2026. Informational content; always confirm current conditions in the official sources before deciding.